

|
In Julius Caesar William
Shakespeare wrote "But I am constant as the Northern Star, of whose true and
resting quality there is no fellow in the firmament." However, had he known
about cosmology, he'd have probably chosen a better comparison than
Polaris, which is actually a variable star.
Stars like
Polaris, called Cepheid variables, have a wonderful property (wonderful
to astronomers, that is). The rate at which they pulsate is simply related to
their luminosity. So, by observing the apparent brightness of a Cepheid and its
period of variability it is straightforward to estimate its distance. Because
astronomers can measure the distance to Cepheids -- and, thus, to
the galaxies they inhabit -- these peculiar stars hold the key to many
important questions in Cosmology.
NASA Scientists announced that they
had used the Hubble Space Telescope to study Cepheid variables and measure the
expansion of the Universe with unprecedented precision. To fully grasp the
meaning of these new measurements it may help to reflect on events 70 years
ago, when a young American astronomer named Edwin Hubble was using the great
telescopes of his day to study the large-scale structure of the Universe.
In 1929, as Hubble pursued his studies of distant galaxies, he realized
something extraordinary. Ten years earlier Shapley had noticed that other
galaxies appeared to be flying away from our own Milky Way. Hubble had the
insight to realize that not only were these objects apparently speeding away,
but the farther away they were, the faster they appeared to be moving. Thus the
Hubble Constant, Ho, was born. Ho is a number which
relates a galaxy's apparent speed of recession to its distance from the Milky
Way, as shown in the graph below.
Scientists now know that the
observed recessional velocites are not distant galaxies flying through space,
all away from the Milky Way, but instead are actually a result of the
expansion of the Universe itself (and everything in it). This expansion
would look the same no matter what galaxy we actually inhabited, and is one of
the visible pieces of evidence that points to a "Big Bang" origin for our
Universe.
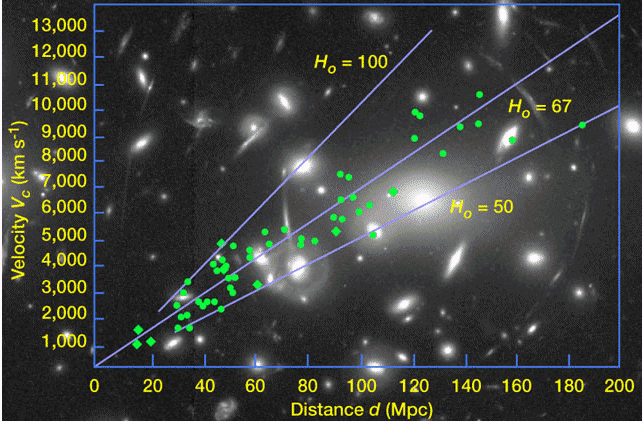
The Hubble Constant describes how fast
objects appear to be moving away from our galaxy as a function of distance. If
you plot apparent recessional velocity against distance, as in the figure
above, the Hubble Constant is simply the slope of a straight line through the
data.
The Hubble Constant is usually expressed in units of
"kilometers per second, per Megaparsec." One parsec is a unit of distance
equal to about 3.2 light years, and a Megaparsec is a million times this, or
about 3.2 million light years. So what the Hubble Constant says is that
for every 3.2 million light years you look out into space, the objects there
appear to be receding from you at a rate of Ho kilometers per
second. If Ho is 100, then the objects appear to recede at 100
km/second for every 3.2 million light years you look out into space. If
Ho is 50, then you have to look about 6.4 million light years out
into space for the same 100 km/second recessional velocity.
But how do astronomers measure Ho in the
absence of a cosmic "radar gun" and mile-markers? There are actually
several ways, each with their own advantages, disadvantages, and sources of
uncertainty. Some involve the study of supernovae with optical telescopes,
others capitalize on a physical process in distant clusters of galaxies called
the Sunyaev-Zeldovich
effect that can be detected by combining X-ray images and microwave
astronomy measurements. Another method, used by scientists working with the
Hubble Space Telescope, for example, involves looking at
"Cepheid Variables" in distant galaxies.
Cepheids (named as a group after the star delta-Cephei) have been known for
quite awhile, and they exhibit a very regular fluctuation in their brightness
on timescales of about 2 to 100 days. Polaris, the "North Star" is
indeed a member of this class of variables. It turns out that the frequency
with which they change their brightness is directly related to the star's
intrinsic luminosity. This so-called "Period-luminosity relationship" was
discovered by Henrietta Levitt, an astronomer who worked at Harvard in the
early decades of this century.
For nearby Cepheids that can easily be
resolved in ground-based telescopes, it is fairly easy to measure both the
brightness and the period of the star. With these measurements in
hand, by using the period-luminosity relationship, one can find the luminosity
of the star. And since the luminosity and brightness are related by an
inverse-square law, the distance to the star can be determined with a bit of
simple 7th or 8th-grade algebra. This works great for stars
within our galaxy, and in some nearby galaxies like M31 (Andromeda) and
M33. Indeed Hubble himself put the question of "the realm of the nebulae"
to bed in 1923 by measuring Cepheids in these galaxies, and deducing a distance
of about 900,000 light years. This distance was at least a factor of 20 or
more farther than any object within our galaxy, showing that these nebulae were
indeed galaxies in their own right, rather than collections of stars, gas, and
dust within our own Milky Way.
But on cosmological scales, 900,000
light years is the equivalent of a local phone call. At these nearby
distances, the cosmological expansion proceeds very slowly (two dots near each
other on the surface of the balloon experiment above hardly move with respect
to one another) with velocities equal to or less than typical random motions of
stars within the galaxy, more like the velocity of the Earth around the Sun,
about 30 km/second or less.
Going deeper into space, where the
expansion proceeds more rapidly, to look at individual Cepheids was a difficult
task for most ground based telescopes. So until the Hubble Telescope came
along, with its ability to resolve Cepheids in extremely distant galaxies,
astronomers had to be a bit more resourceful in getting at the Hubble
Constant.
And resourceful they were. Using a variety of methods,
many fraught with uncertainty and large systemtic errors, the answers have
traditionally come out somewhere between 50 km/s/Mpc and 100 km/s/Mpc. And
therein lies the rub. In this difference between 50 and 100 km/s/Mpc lies
the fate of the entire Universe.
Ten+1 measurements of
the Hubble Constant
|
Method
Used |
Citation |
Value
(km/second/Megaparsec) |
| Cepheid variables in distant galaxies |
W. Freedman et al (1999) |
70 +/- 7 |
| M101 group velocity and distance |
Sandage and Tammann (1974) |
55.5 +/- 8.7 |
| Virgo Cluster |
Peebles (1977) |
42 - 77 |
| Globular Clusters |
Hanes (1979) |
80 +/- 11 |
| Virgo Sc HII luminosities |
Kennicutt (1981) |
55 |
| Type I supernovae |
Branch (1979) |
56 +/- 15 |
| Type I supernovae |
Sandage and Tammann (1982) |
50 +/- 7 |
| Infrared Tully-Fisher relation |
Aaronson and Mould (1983) |
82 +/- 10 |
| SN-Ia and Cepheids |
Sandage, et al. (1994) |
55 +/- 8 |
| |
|
80 +/- 17 |
| |
|
90 +/- 10 |
The fate of the Universe actually
depends on four numbers, which have been described as the "Holy Grail of
Cosmology." Three of these numbers are independent, meaning if you find three,
the fourth one can be computed from the three you know. Among these
numbers is the Hubble Constant.
The first number is called the ``deceleration parameter,'' and
it is a measure of how fast the cosmological expansion is speeding up or
slowing down. Or, colloquially, does the Universe have it's foot on the
gas or on the brake? Written by scientists as qo ("q-naught"),
a positive value of the deceleration parameter means the universe is slowing
down (foot on the brake), a value of 0 means the universe is expanding at a
constant speed (coasting), and a negative value means that the universe is
accelerating (foot on the gas).
The second number is the ``density
parameter.'' Called either `omega' or `sigma,' depending on the units one
uses, this number describes how much "stuff" is in the universe. The larger the
density parameter, the more stuff there is. Issues related to "missing mass"
are often tied up in measurements of the density parameter that turn out to be
smaller than one needs to theoretically halt the expansion, for example through
the self-gravitation of all objects in the Universe.
The third number
is simply the age of the universe. How old is this place? We can
actually get a decent handle on lower-limits to this number simply by
recognizing that the universe has to be older than the oldest objects in
it. Radioactive isotope studies yield ages of at least nine to sixteen
billion years for our Galaxy, and the ages of the oldest star clusters put the
limit at about 14 billion years. Give or take a billion years, a
reasonable lower limit to the age of the Universe turns out to be about 15
billion years.
The fourth number is our Hubble Constant
Ho. Two other numbers that are often discussed in cosmology,
the "cosmological constant," which Einstein referred to as one of his greatest
blunders, and the "curvature of the Universe," are determined by the density
parameter and the deceleration parameter.
The way these numbers play
together mathematically allows one to write the product of Ho and
the age of the universe as some function of the density parameter and the
deceleration parameter.
(Age of the
Universe) x (Hubble Constant) = A complicated function of the density
and deceleration parameters
In other words, given our fairly robust limit of the age of
the Universe, and a reliable measurement of the Hubble Constant, their
product restricts our Universe to only a very limited set of combinations of
density parameter and deceleration parameter, many of which can be further
ruled out by other independent observations. Conversely, if one assumes a
cosmological model (i.e. values for sigmao and qo), a
measure of the Hubble Constant can give you a measure of the age of the
universe.
Regardless of the approach, by getting a reliable
measurement of the Hubble Constant, we therefore have a much greater
understanding of the nature and eventual fate of the Universe. If the
Hubble Constant is large enough, for example, for a given age of the Universe,
the deceleration parameter must be negative, meaning that the Universe is not
slowing down, but instead is accelerating its expansion.
One can
actually draw a "map" of where our Universe might be within the realm of all
possibilities, to see these implications of a measurement of
Ho. Using the `sigma-q' notation, it looks something like the
accompanying figure.
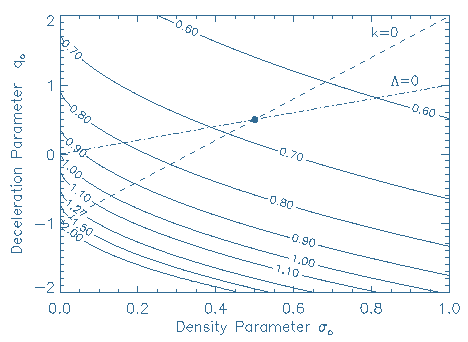
The density parameter `sigmao' is plotted on the
horizontal axis, and the deceleration parameter `qo' is plotted on
the vertical axis. High-density, rapidly decelerating universes are
represented at the upper right part of the diagram, and rapidly accelerating,
low-density universes are at the lower left. The diagonal
dot-dashed line that runs from the origin (0,0) upwards to the right represents
universes where the cosmological constant (lambda) is zero (sigmao =
qo). Below this line, the cosmological constant is positive,
above it, it's negative. The second diagonal line, dashed-only, delineates
the universes that have flat topology (k = 3 sigmao - qo
- 1 = 0).
|
The
Einstein-deSitter Universe |
The dot located at sigmao=qo=0.5 in the
accompanying diagram is the so-called "Einstein de Sitter" universe. It
is unique in the sense that it is the only universe that possesses flat
topology, and has a zero cosmological constant.
Mathematically, it is
much easier to treat as well, as many of the equations can be done by hand in
this unique case. The model has been a favorite of scientists for
aesthetic, theoretical, and other reasons.
If one assumes that this
model is indeed the one that describes our Universe, large measurements of the
Hubble Constant can result in an age of the Universe that is younger than the
objects we know are in it, an obvious impossibility.
In such a case,
either the model is not the correct one, or the measurement of Ho is
in error. |
The curves from upper left to lower right are the locus of
points where the Hubble Constant times the age of the Universe equals
some number, indicated on the line. For example, the
Einstein-deSitter model located at the bold dot (sigmao =
qo = 1/2) has a value of Ho times the age of the universe
equal to 2/3. By measuring the Hubble Constant and multiplying by the age of
the Universe, we are restricted to live on one of these curves.
We are somewhere on this diagram...but where?
A value of Ho = 70 km/second/Mpc in an Einstein-de
Sitter Universe results in an age of the universe slightly less than 10 billion
years, and with the uncertainty in Ho, a value of about 12 billion
years is likely not out of the question for this model.
With an age of 15 billion years, consistent with the ages of
the oldest star clusters, and a Hubble Constant measurement of 70 km/s/Mpc, one
obtains a product of 1.07 (when the units are accounted correctly). This,
combined with a strong theoretical impetus for a flat topology (k = 0), would
confine our position to a narrow area in the lower left of the diagram, with a
positive cosmological constant.
It is indeed possible that our
latest measurements of the Hubble Constant may have shown us that our universe
is accelerating, and will continue to do so forever. Nature appears to have its
foot on the cosmological gas pedal - and we're along for the ride.
|
